For this challenge, you’ll be assuming the role of a BI Consultant for Maven Communications, a California-based Telecommunications company.
You’ve been hired to help the company improve retention by identifying high value customers and churn risks, and have been asked to present your findings to the CMO in the form of a single page report or dashboard.
About the dataset
This dataset contains 2 tables, in CSV format:
- The Customer Churn table contains information on all 7,043 customers from a Telecommunications company in California in Q2 2022
- Each record represents one customer, and contains details about their demographics, location, tenure, subscription services, status for the quarter (joined, stayed, or churned), and more!
- The Zip Code Population table contains complimentary information on the estimated populations for the California zip codes in the Customer Churn table
Let’s Start !!
NB: For this challenge the dataset is already cleaned, so we’ll start directly with the analysis.
There will be a query with a comment explaining what I’m calculating followed by an image (the MySQL tab result and an excel visualization to show the data).
Before creating the dashboard the first thing I do is analyze the dataset in MySQL.
Let’s have a look at the dataset:
SELECT * FROM customer_churn;
Now, we can start with our exploratory analysis.
Scroll to the right for the full query
-- Calculate the number of new, active and churned customers.
SELECT
	COUNT(CASE WHEN customer_status = "Stayed" THEN 1 ELSE NULL END) AS active_customers,
    COUNT(CASE WHEN customer_status = "Churned" THEN 1 ELSE NULL END) AS churned_customers,
    COUNT(CASE WHEN customer_status = "Joined" THEN 1 ELSE NULL END) AS new_customers
FROM customer_churn;

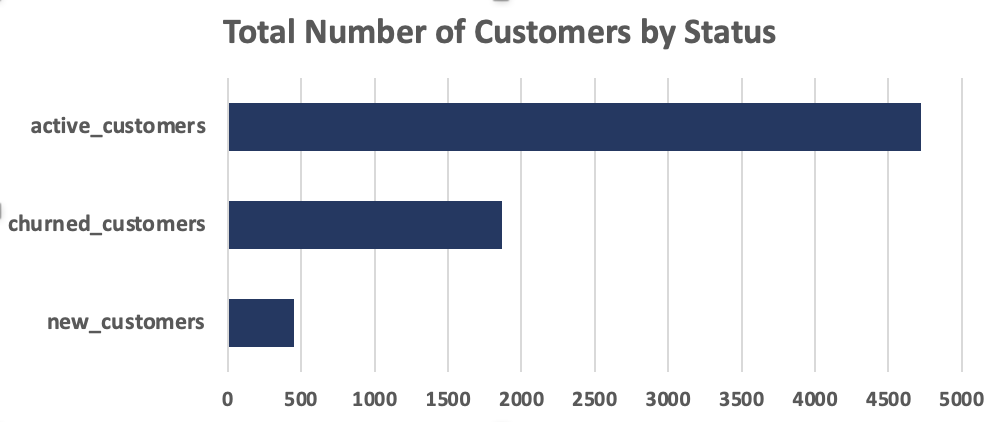
———————————————-
-- Calculate how churned customers are affecting our revenue
SELECT
	customer_status,
	ROUND(SUM(total_revenue),0) AS revenue
FROM customer_churn
GROUP BY 1
ORDER BY 2 DESC;

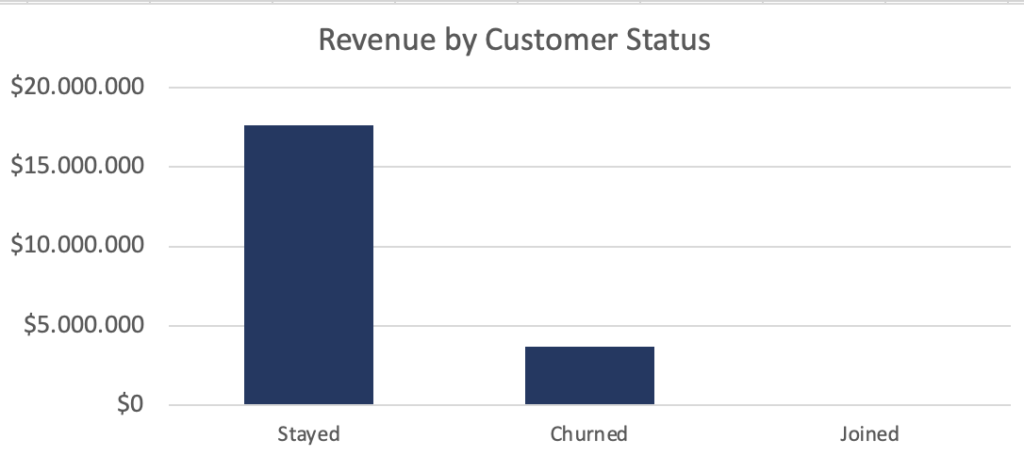
Total revenue is around $21 Mil, the churned revenue is $3.7 Mil.
How long does a customer stay before to churn?
-- number of churned customers by month
SELECT
	tenure_in_months,
    COUNT(customer_id) AS total_churned_customers
FROM customer_churn
WHERE customer_status = "Churned"
GROUP BY 1
ORDER BY 2 DESC;
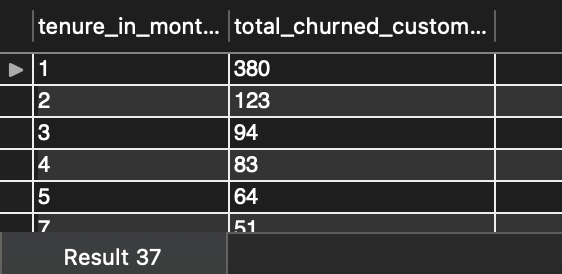
380 customers on a total of 1869 churned customers leave in the first month, it means the 20% and almost 40% in the first 5 months.
So now we know the total of churned customers, how much they affect our revenue and we know that most of them churn in the first months.
Let’s continue.
—————————————–
-- Churned Customers by Category
SELECT
	churn_category,
    COUNT(customer_id) AS total
FROM customer_churn
WHERE customer_status = "Churned"
GROUP BY 1
ORDER BY 2 DESC;

--Churned Customers by Reason
SELECT
	churn_reason,
    COUNT(customer_id) AS total
FROM customer_churn
WHERE customer_status = "Churned"
GROUP BY 1
ORDER BY 2 DESC;
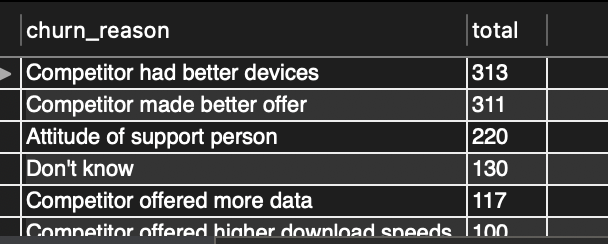
The main reason customers churn is due to competitors, based on customers’ reasons, competitors offer better devices and offer better deals.
Another reason to note is the attitude of the customer support.
—————————————–
-- Churned customers by Internet Type
SELECT
	internet_type,
    COUNT(customer_id) AS total
FROM customer_churn
WHERE customer_status = "Churned" AND internet_type != ""
GROUP BY 1
ORDER BY 2 DESC;
——————————————
-- Churned customers by Type of Contract
SELECT
	contract,
    COUNT(customer_id) AS total
FROM customer_churn
WHERE customer_status = "Churned"
GROUP BY 1
ORDER BY 2 DESC;
—————————————
-- Churned customers by city
SELECT
	city,
    COUNT(customer_id) AS total
FROM customer_churn
WHERE customer_status = "Churned"
GROUP BY 1
ORDER BY 2 DESC;
—————————————
-- Offer type for churned customers
SELECT
	offer,
    COUNT(customer_id) AS total
FROM customer_churn
WHERE customer_status = "Churned"
GROUP BY 1
ORDER BY 2 DESC;
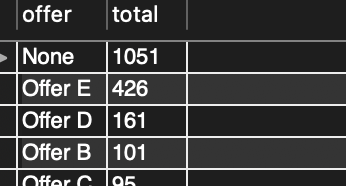
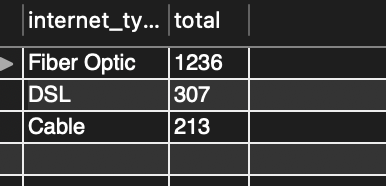
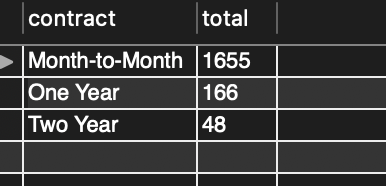
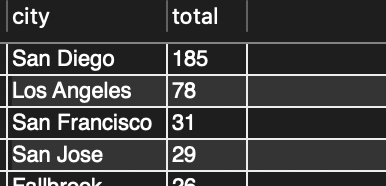
We can see also as the major of churned customers have the Fiber Optic, a month-to-month subscription, are from San Diego and Los Angeles and they have the “Offer E” or not offer at all.
—————————————-
So far we have an overview of what are the top reasons and other info of the churned customers, now let’s analyze the high-value customers.
First of all, we have to define who is a “High-Value Customer”, we’ll use these parameters:
- total revenue > 3000
- monthly charge >= 85
- customer status = “Stayed”
-- High Value Customers
SELECT
	customer_id
FROM customer_churn
WHERE
    total_revenue > 3000 AND
    monthly_charge >= 85 AND
    customer_status = "Stayed";
————————————-
Now that we have the list of all our High Value Customers, we can use this list to go deeper, see where these customers live, what type of contract they have, subscriptions of extra services, etc.
We can create a temporary table with the above query and then we can join it with the “customer_churn” table to see from which city they are from.
-- Create the temporary table with the high value customers
CREATE TEMPORARY TABLE high_value_customers
SELECT
	customer_id
FROM customer_churn
WHERE
    total_revenue > 3000 AND
    monthly_charge >= 85 AND
    customer_status = "Stayed";
-- Join the high value customer table with the customer churn table
SELECT
	cc.city,
    COUNT(hvc.customer_id) AS total
FROM customer_churn cc
	LEFT JOIN high_value_customers hvc
		ON cc.customer_id = hvc.customer_id
GROUP BY 1
ORDER BY 2 DESC
LIMIT 3;

Now we can use the last query, changing the voice “city”, with what we want to check, for example, “Type of contract”, “Revenue”, etc.
Because the query will be the same as above except for the first voice I’ll avoid to repeat the query.
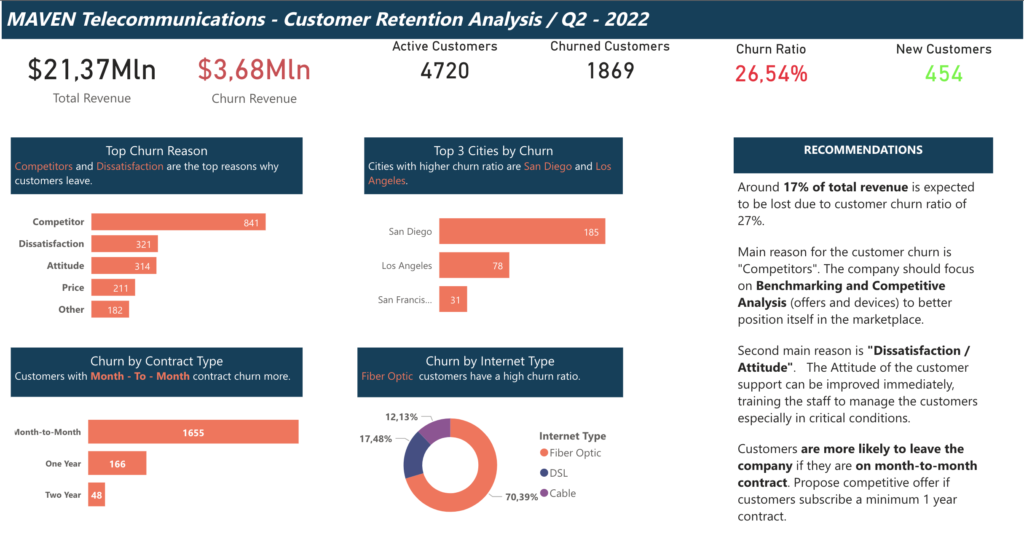
Finally, we have some interesting info to understand why customers churn and who are our high value customers so we can proceed to create the dashboard to present to the CTO with our recommendations.
The dashboard will show the key points, such as the number of customers for each category, the revenue, what are the reasons why customers churn and lastly our recommendations.
The dashboard it’s available at the following link: View Dashboard
Dashboard preview:
Thanks for your time.
Giulio Pulino.
Back to portfolio