Step by Step tutorial on how to create a Crypto Wallet Dashboard with Excel and PowerBi using API from CoinMarketCap.
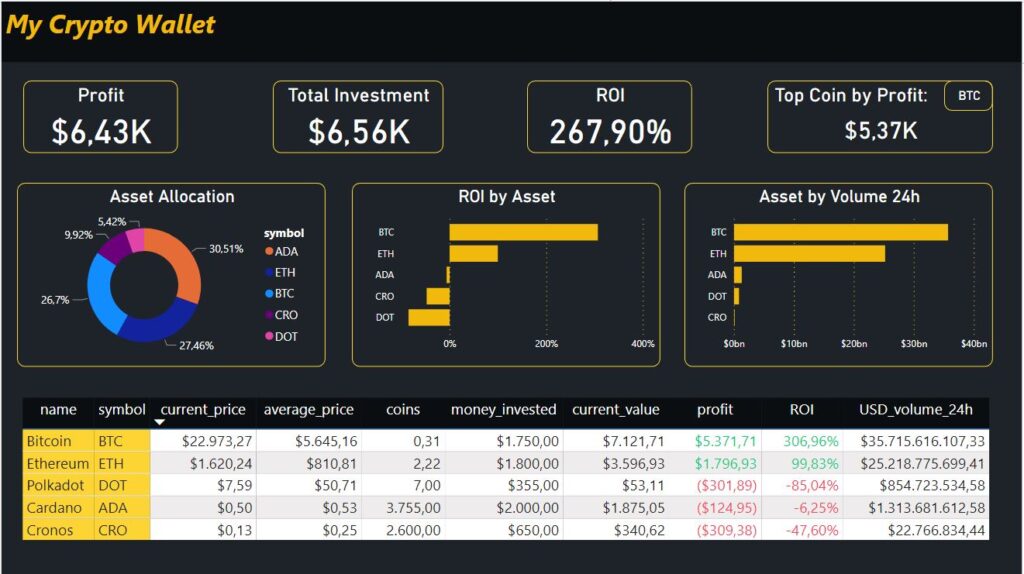
The dashboard will show the price of the crypto in real-time (just click on refresh to have the data updated) so that we can keep track easily of our investments.
Below my dashboard in PowerBi, if you wish you can scroll down and see the entire process step by step.
The Dashboard it’s available at the following link:
View DashbaordPreview of the Dashboard.
Step by Step Tutorial.
We’ll start with Excel, you can start directly in PowerBi, the process it’s the same, but in PowerBI it’s more tedious to update the data, that’s why I suggest you start in Excel.
Let’s Start !!
First of all we have to create a FREE account on CoinMarketCap:
https://coinmarketcap.com/apiAfter that we can start to import and format the data and create our dashboard.
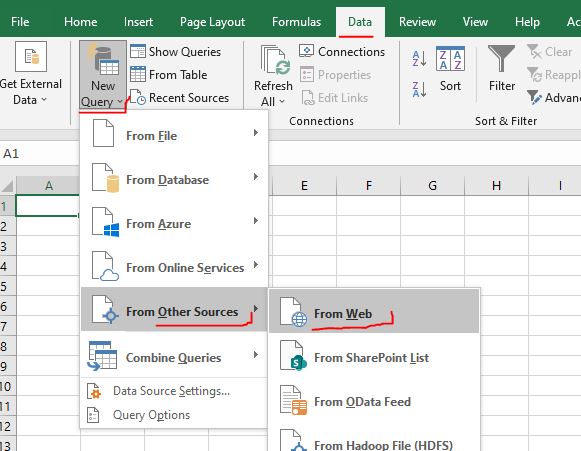
Open Excel, go to the “Data”tab, click on “New Query” -> “From Other Sources” -> “From Web”
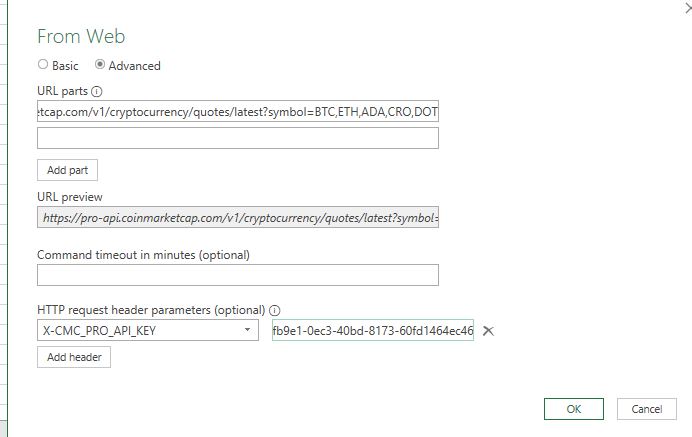
Select “Advanced” and fill in as follows:
URL parts: https://pro-api.coinmarketcap.com/v1/cryptocurrency/quotes/latest?symbol=
After the equal sign, insert the symbols of the coin that you want, in my case BTC,ETH,ADA,CRO,DOT
So the link will be: https://pro-api.coinmarketcap.com/v1/cryptocurrency/quotes/latest?symbol=BTC,ETH,ADA,CRO,DOT
In the HTTP Request Header insert: X-CMC_PRO_API_KEY (you can find it in the documentation API page, at the following link: coinmarketcap.com/api/documentation )
And lastly your API Key, then click OK.
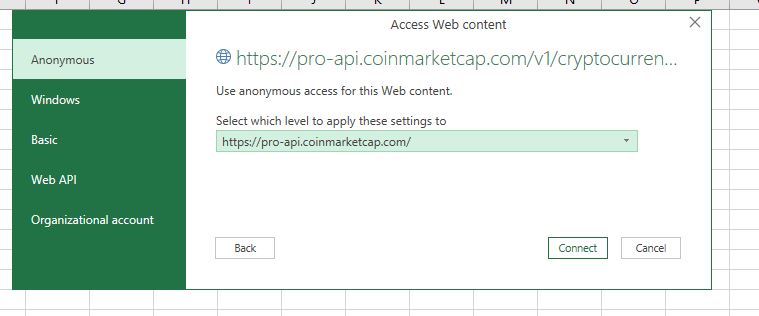
Select how to connect, I’ve selected Anonymous
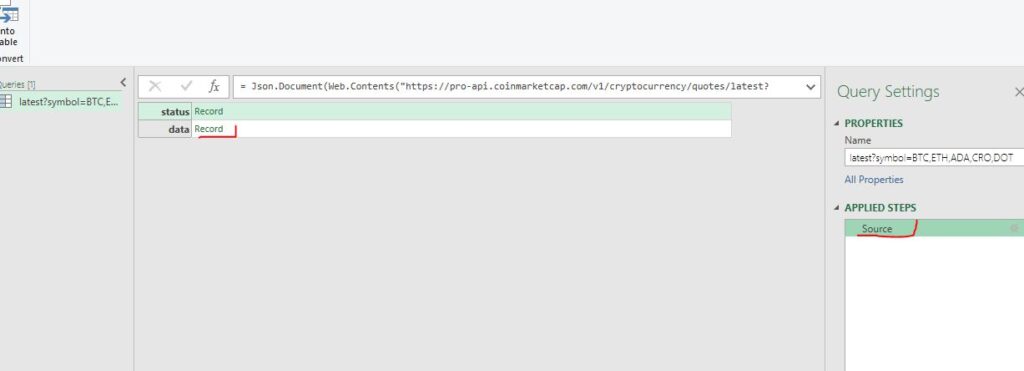
Now we are into PowerQuery, go on the top right side menu, and click on source, on the center a new table appears, click on “Record” of the DATA row.
Then click “Into Table” on the top left.
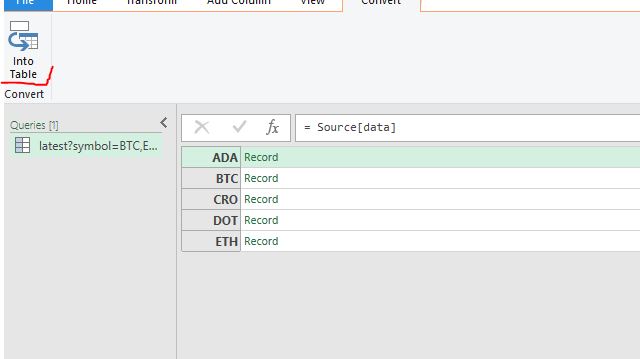
Now you have the data as follows, click on the 2 arrow icon
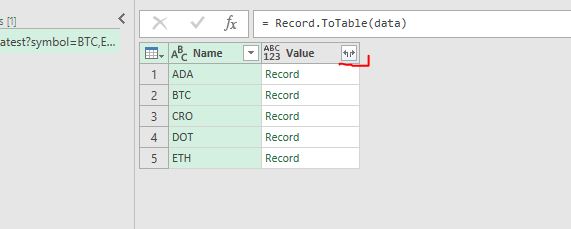
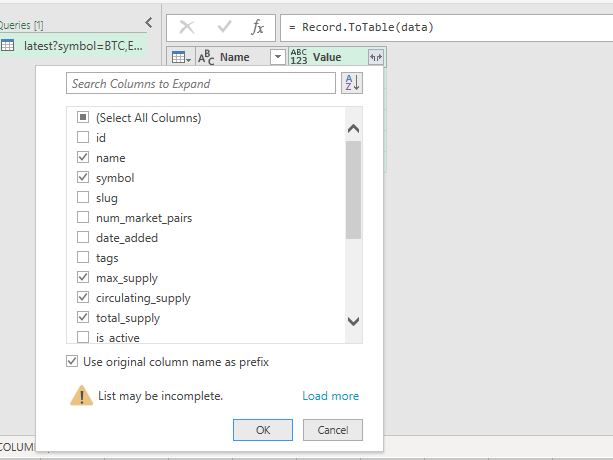
You’ll see a list of columns, uncheck everything and select what you need, in my case I selected name, symbol, max_supply, circulating_supply, total_supply and quote. (Quote is at the bottom of the list, remember to add it), then click OK.
On the generated table, select the “value.quote” column, click on the arrow icon, and then OK.
NB: the NULL values on max_supply are normal because some coins don’t have a fixed number of coins.
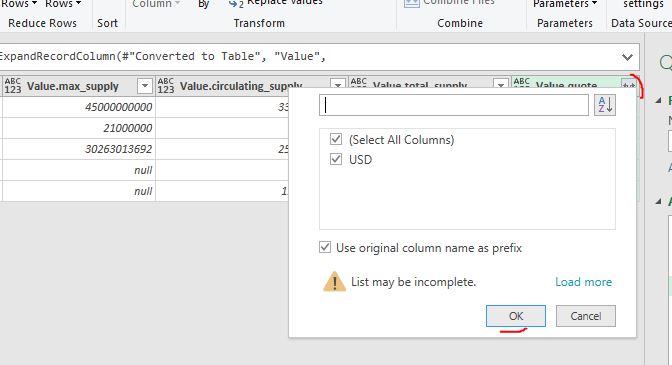
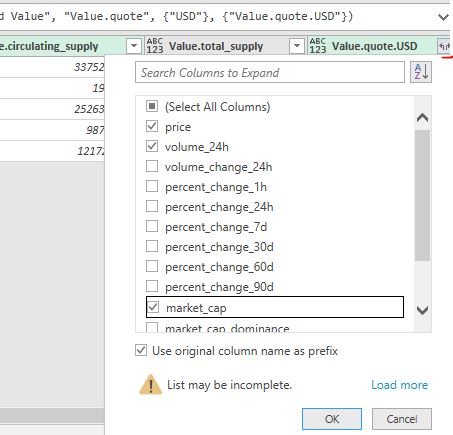
Now reopen the same column clicking on the double arrow icon, and you can find new voices, I selected price, volume_24h and market_cap.
Let’s rename the columns, just double-click on the column name and rename it.
For example replace NAME, with symbol, value.id with id, etc…
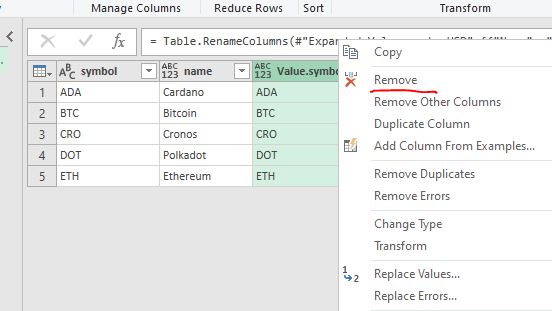
If you find a duplicate column, right-click on it and remove it.
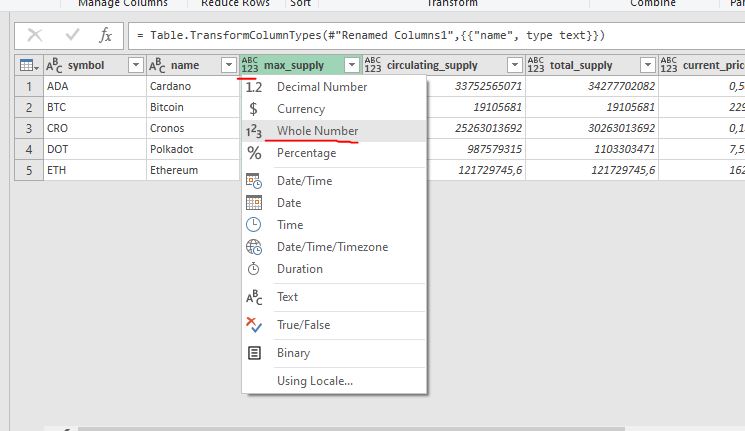
We have to format all columns to the correct data type, for example symbol as TEXT, USD_price as decimal number, etc.. click on the icon at the left of the column name and select the desired data type.
We need extra columns that we have to calculate ourselves, in the top menu, select “Add column” -> “column from example” -> “from all columns”
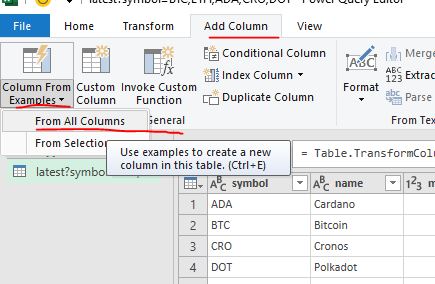
The first column will be called “money_invested”, and add for each row how much money you invested in the specific coin, then click OK.

Repeat the process and create another new column called coins (enter the number of coins you have)
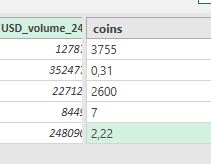
Now we need new columns but with calculated data, so we’ll add formulas.
Let’s add the first one, “average_price”.
This time click on “custom_column”, give a name to the column and from the right menu, select the voices to calculate the average price, just click one time on it and then click insert, in this case the formula is: ” money_spent / coins “, then click OK.
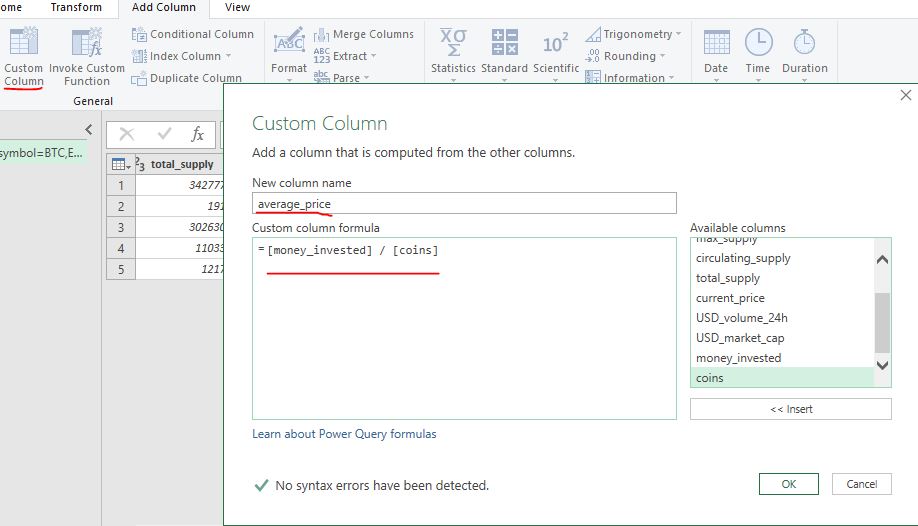
Add more custom columns, the process is always the same, just change the formula.
current_value = current_price * coins
profit = current_value – money_invested
ROI = profit / money_invested
Last step 🙂 format all these new columns as decimal, except the ROI which will be percentage.
That’s all, select HOME and click on Close & Apply.
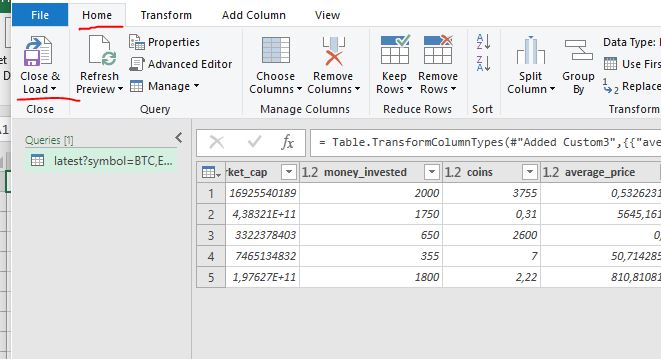
Now we have the data in the table, we have just to convert some columns to currency as per image.

You can save the file and close it.
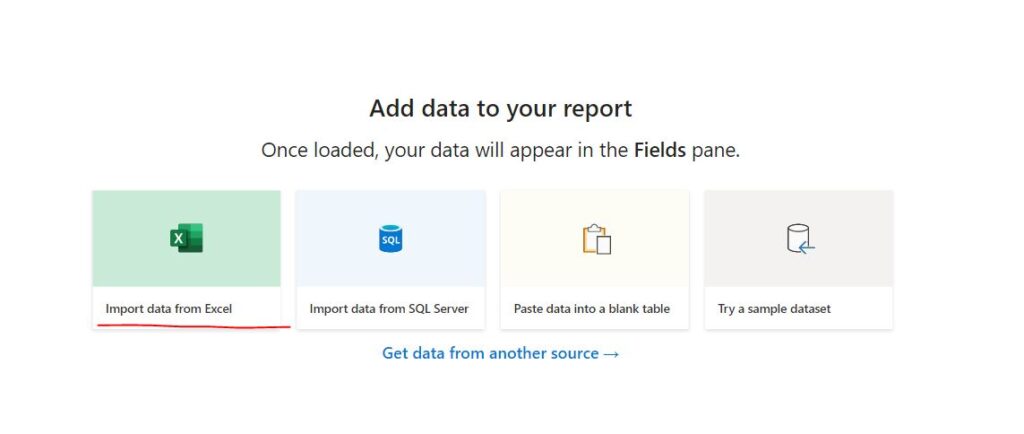
Open PowerBI, and import the excel file.
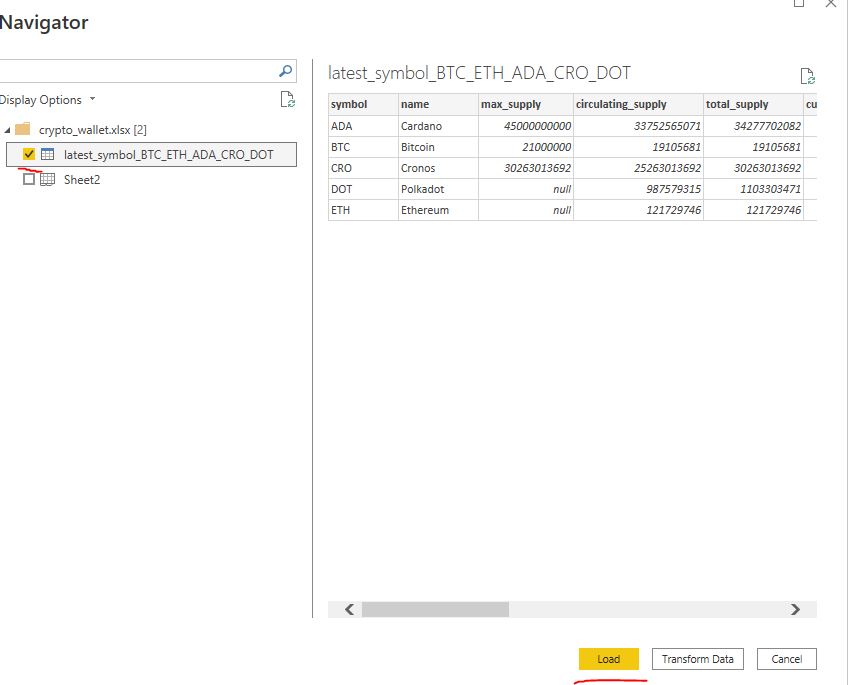
In the next menu, flag the sheet, and click LOAD.
Click on the TABLE icon on the left side menu, we have to convert some columns to currency as per the image.

And that’s it, now go to the view tab and create your dashboard, here my design, what’s yours ?
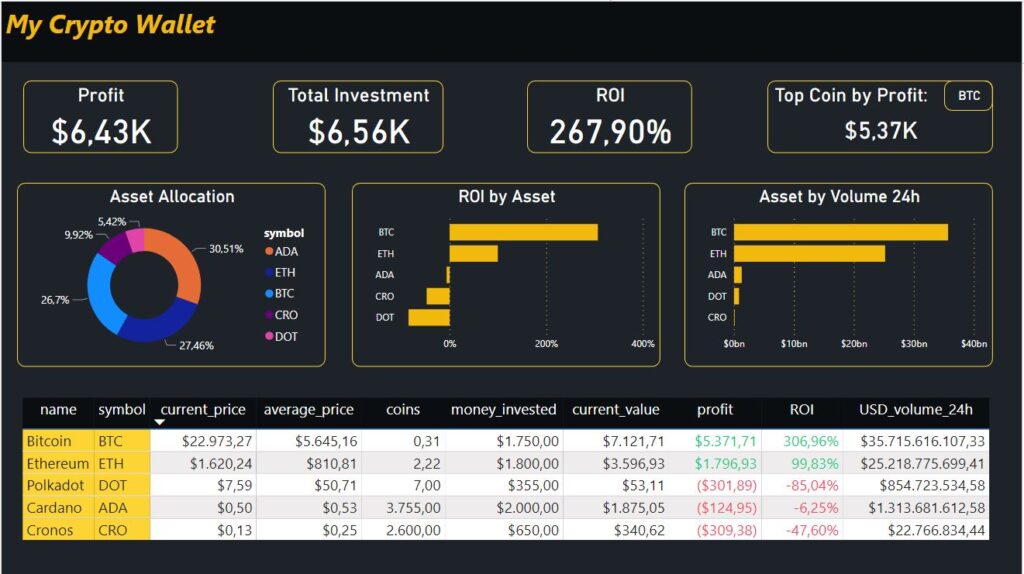
Thanks for your time.
Giulio Pulino.