Average purchase price
money_invested / coinsThe amount invested divided by the number of coins held.
From API data to a portfolio dashboard
Bringing cryptocurrency quotes and portfolio holdings together in one dashboard.
View Power BI Dashboard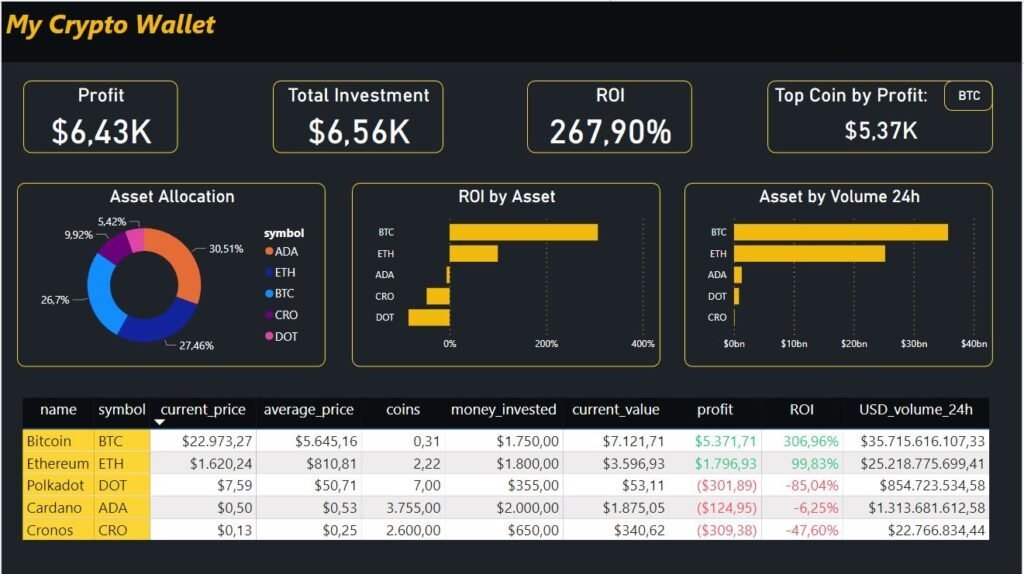
In 2022, I built a cryptocurrency portfolio tracker using Excel, Power Query, and Power BI. The project combined quotes from the CoinMarketCap API with entered investment amounts and coin quantities, then presented the results in a single report.
The workflow used a manual refresh to retrieve updated quotes before calculating holding values. The dashboard shown here is the historical project output.
I wanted a straightforward way to compare the amount invested in each cryptocurrency with the value of the holdings at the time of refresh. The report brought investment, profit, ROI, and allocation into one view, with a breakdown by asset.
The workflow
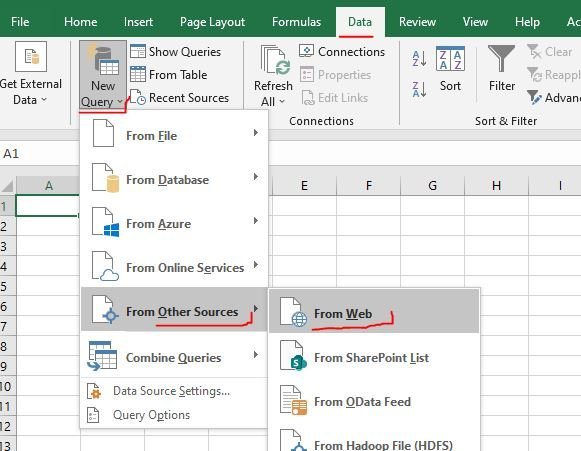
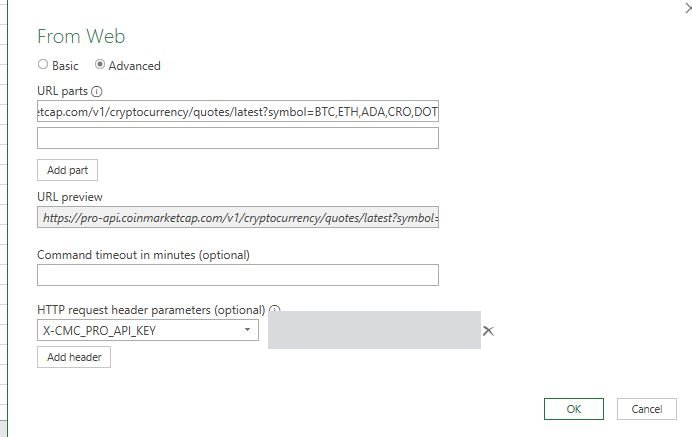
I started in Excel with a web query to CoinMarketCap’s cryptocurrency quotes endpoint. The request selected BTC, ETH, ADA, CRO, and DOT and authenticated through the X-CMC_PRO_API_KEY header.
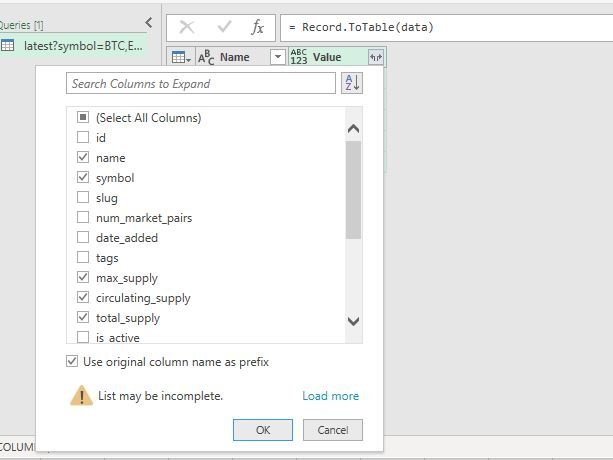
In Power Query, I opened the response’s data record, converted it into a table, and expanded the coin records. I kept the name, symbol, maximum supply, circulating supply, total supply, and quote fields.
I then expanded the USD quote to retrieve price, 24-hour volume, and market capitalization, removed duplicate columns, renamed fields, and assigned suitable data types.
I entered money_invested and coins for each asset, then added calculated columns for average purchase price, holding value, profit, and ROI. Decimal and currency formats made the values readable, with ROI displayed as a percentage.
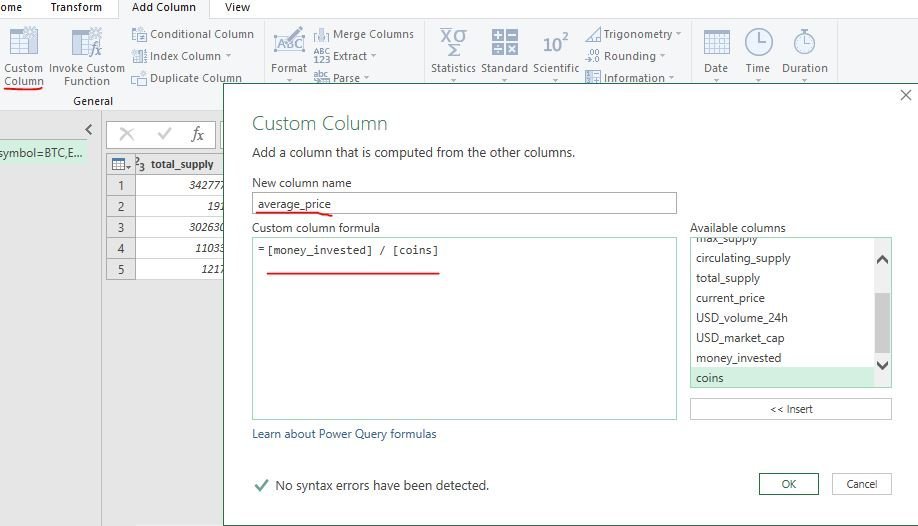
money_invested / coinsThe amount invested divided by the number of coins held.
current_price * coinsThe imported quote multiplied by the number of coins held.
current_value - money_investedHolding value less the amount invested.
profit / money_investedProfit relative to the amount invested, formatted as a percentage.
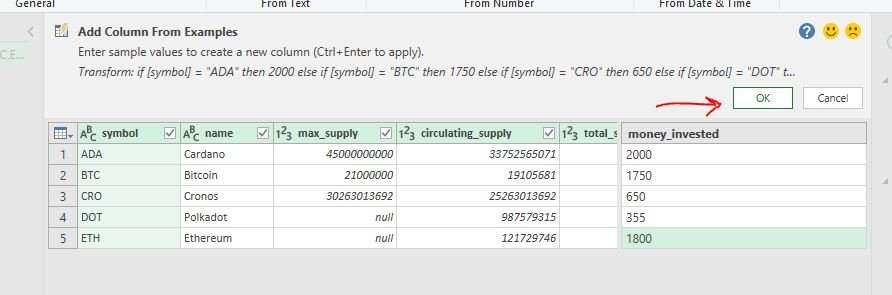

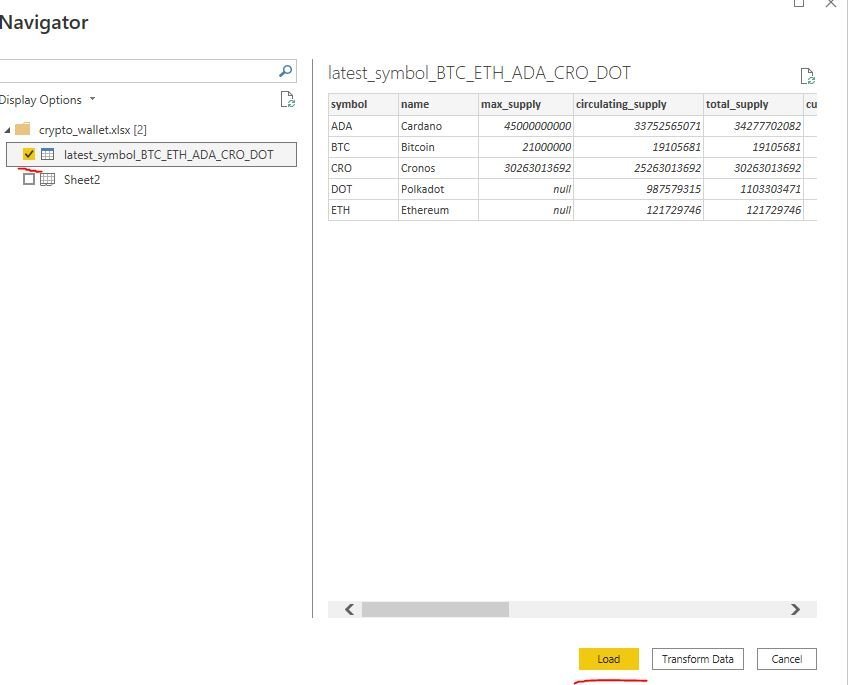
I saved the Excel file, imported its table into Power BI, and formatted the relevant fields as currency. The prepared data then supplied the report’s summary cards, asset comparisons, allocation chart, and holdings table.
The report combined an overall portfolio summary with asset-level detail:
The figures in the original screenshots reflect their respective capture times; the workflow and dashboard images are historical snapshots.
The finished project connected a web-data import, portfolio calculations, and a visual report. It brought the five assets into one view, allowing investment amounts and holding values to be compared alongside profit and ROI.
The 2022 dashboard above shows the final design: a dark background, yellow accents, summary metrics across the top, asset comparisons in the middle, and detailed holdings below.