Does consistently backing the favorite in a tennis match produce a profit? In this 2022 project, I used historical match results and bookmaker odds to examine that assumption through four fixed betting rules.
A favorite can win frequently without producing a positive return. The analysis therefore compares total stakes with total winnings, rather than judging a strategy by how often its selections win.
Dataset
I used ATP tennis match data from 2010–2021, sourced from Tennis-Data. The records include tournaments, players, rankings, match results, and decimal odds from Bet365 and Pinnacle.
Coverage
2010–2021
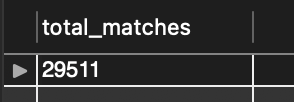
Matches in the analysis
29511
SQL dialect
MySQL-style SQL
Original SQL result
Data Preparation
I combined twelve annual tables into atp_matches using UNION ALL. The preparation script standardizes dates and bookmaker odds, then applies match-status and data-availability rules.
Parse dates with STR_TO_DATE and replace decimal commas in odds fields.
Remove walkovers and records marked Disqualified, Sched, or Awarded.
Exclude rows with missing Pinnacle winner odds or Bet365 winner odds.
Correct the misspelled retirement status and remove selected cases where the first set was incomplete.
These exclusions define the match population used for the historical comparison.
Analysis Methodology
Each qualifying selection uses a fixed stake of 10. Winnings include the returned stake; profit is winnings minus total stake. Pinnacle prices are used for the four strategies, after the bookmaker comparison below.
Favorite at odds ≤ 1.30
Back the favorite only when either Pinnacle price is 1.30 or lower.
Favorite at odds ≤ 1.10
Apply the same approach with a tighter price threshold of 1.10.
Favorite at any odds
Back the lower-priced player without a threshold; equal-price matches are excluded.
Top 10 versus rank 20 or worse
Back a player ranked in the top 10 against an opponent ranked 20 or worse.
In the SQL, PSW and PSL hold Pinnacle prices for the match winner and loser. WRank and LRank hold their respective rankings.
From rules to queries
SQL Analysis
Selected original queries show how the comparisons and strategy rules were expressed in SQL.
Compare bookmaker margins
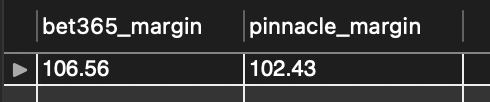
Average the sum of the implied probabilities for each bookmaker. A lower combined percentage indicates a smaller pricing margin.
SELECT ROUND(AVG((100 / B365W) + (100 / B365L)),2) AS bet365_margin, ROUND(AVG((100 / PSW) + (100 / PSL)),2) AS pinnacle_marginFROM atp_matches;
Calculate Strategy 1 returns
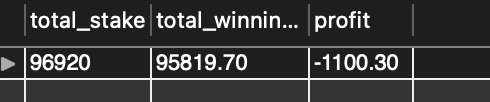
Count qualifying bets at a fixed stake, sum the returns from winning selections, and subtract the total stake.
SELECT 10 * COUNT(CASE WHEN PSW <= 1.30 OR PSL <= 1.30 THEN 1 ELSE NULL END) AS total_stake, ROUND(SUM(CASE WHEN PSW <= 1.30 THEN 10 * PSW ELSE NULL END),2) AS total_winnings, ROUND(SUM(CASE WHEN PSW <= 1.30 THEN 10 * PSW ELSE NULL END),2) - (10 * COUNT(CASE WHEN PSW <= 1.30 OR PSL <= 1.30 THEN 1 ELSE NULL END)) AS profitFROM atp_matches;
Group Strategy 1 by year
Use YEAR(match_date) to examine how the same strategy performed across individual seasons.
SELECT YEAR(match_date) AS yr, 10 * COUNT(CASE WHEN PSW <= 1.30 OR PSL <= 1.30 THEN 1 ELSE NULL END) AS total_stake, ROUND(SUM(CASE WHEN PSW <= 1.30 THEN 10 * PSW ELSE NULL END),2) AS total_winnings, ROUND(SUM(CASE WHEN PSW <= 1.30 THEN 10 * PSW ELSE NULL END),2) - (10 * COUNT(CASE WHEN PSW <= 1.30 OR PSL <= 1.30 THEN 1 ELSE NULL END)) AS profitFROM atp_matchesGROUP BY 1ORDER BY 1 DESC;
Select top-10 ranking matchups
Use winner and loser rankings to identify qualifying matches, then calculate the return from the top-10 selection.
SELECT 10 * COUNT(CASE WHEN (WRank <= 10 AND LRank >= 20) OR (WRank >= 20 AND LRank <= 10) THEN 1 ELSE NULL END) AS total_stake, ROUND(SUM(CASE WHEN WRank <= 10 AND LRank >= 20 THEN 10 * PSW ELSE NULL END),2) AS total_winnings, ROUND(SUM(CASE WHEN WRank <= 10 AND LRank >= 20 THEN 10 * PSW ELSE NULL END) - 10 * COUNT(CASE WHEN (WRank <= 10 AND LRank >= 20) OR (WRank >= 20 AND LRank <= 10) THEN 1 ELSE NULL END),2) AS profitFROM atp_matches;
Historical results
Results
The figures below preserve the results published with this 2022 analysis.
Bookmaker comparison
The average combined implied probability was lower for Pinnacle.
Average implied-probability total
Bet365
Pinnacle
106.56
102.43
Original SQL result
Winner-known comparison
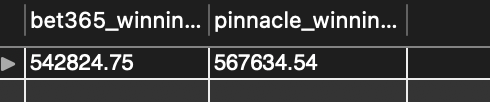
A hypothetical 10-stake bet on every eventual winner produced higher total winnings with Pinnacle. This comparison assumes advance knowledge of the winner; it is not a betting strategy.
Total winnings when every winner is known
Bet365
Pinnacle
542824.75
567634.54
Original SQL result
Four strategies, four negative returns
Published strategy totals · fixed stake of 10 per selection
Strategy
Total stake
Winnings
Profit
1. Favorite at odds ≤ 1.30
96920
95819.70
-1100.30
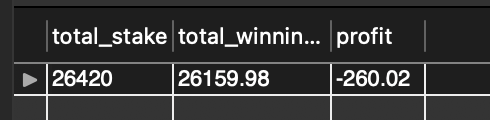
2. Favorite at odds ≤ 1.10
26420
26159.98
-260.02
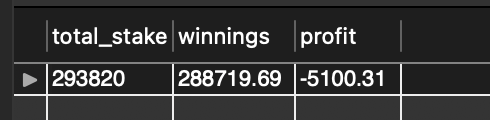
3. Favorite at any odds
293820
288719.69
-5100.31
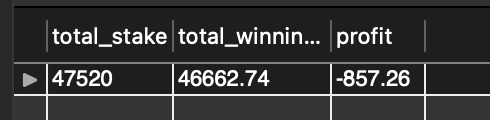
4. Top 10 versus rank 20 or worse
47520
46662.74
-857.26
Strategy 1
Original SQL result
Strategy 2
Original SQL result
Strategy 3
Original SQL result
Strategy 4
Original SQL result
Strategy 1 by year
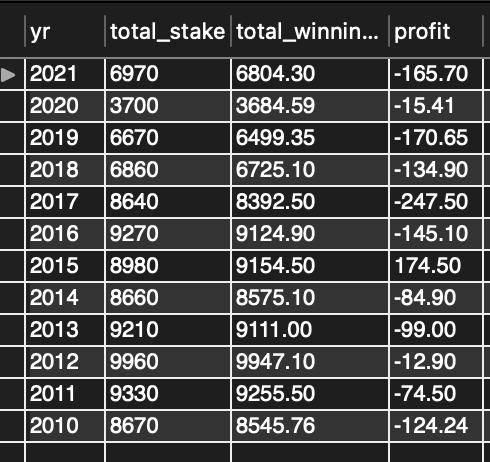
The yearly breakdown shows a positive result in 2015, while every other displayed year is negative.
Favorite at odds ≤ 1.30 · annual results
Year
Total stake
Winnings
Profit
2021
6970
6804.30
-165.70
2020
3700
3684.59
-15.41
2019
6670
6499.35
-170.65
2018
6860
6725.10
-134.90
2017
8640
8392.50
-247.50
2016
9270
9124.90
-145.10
2015
8980
9154.50
174.50
2014
8660
8575.10
-84.90
2013
9210
9111.00
-99.00
2012
9960
9947.10
-12.90
2011
9330
9255.50
-74.50
2010
8670
8545.76
-124.24
Original SQL result
Key Findings & Conclusion
All four tested strategies produced a loss in the published results. Restricting selections to very short-priced favorites did not turn the approach profitable, and using a ranking gap did not produce a positive return either.
The bookmaker comparison also shows why price matters: the same hypothetical winning selections generated different returns with Bet365 and Pinnacle.
For this historical sample and these selection rules, consistently backing favorites was not profitable. A high likelihood of winning an individual match is not enough to establish a profitable betting approach.
Limitations
The analysis covers ATP data from 2010–2021 and does not establish how the strategies perform in later periods or other competitions.
Results depend on the recorded bookmaker prices and the exclusions applied during preparation.
Strategies use fixed stakes and simple selection rules; they do not model changing prices or alternative staking methods.
The winner-known comparison is hypothetical and cannot be replicated as a real selection method.